Side projects
Six days, one record.
An interactive look at Megan Eckert’s six-day run.

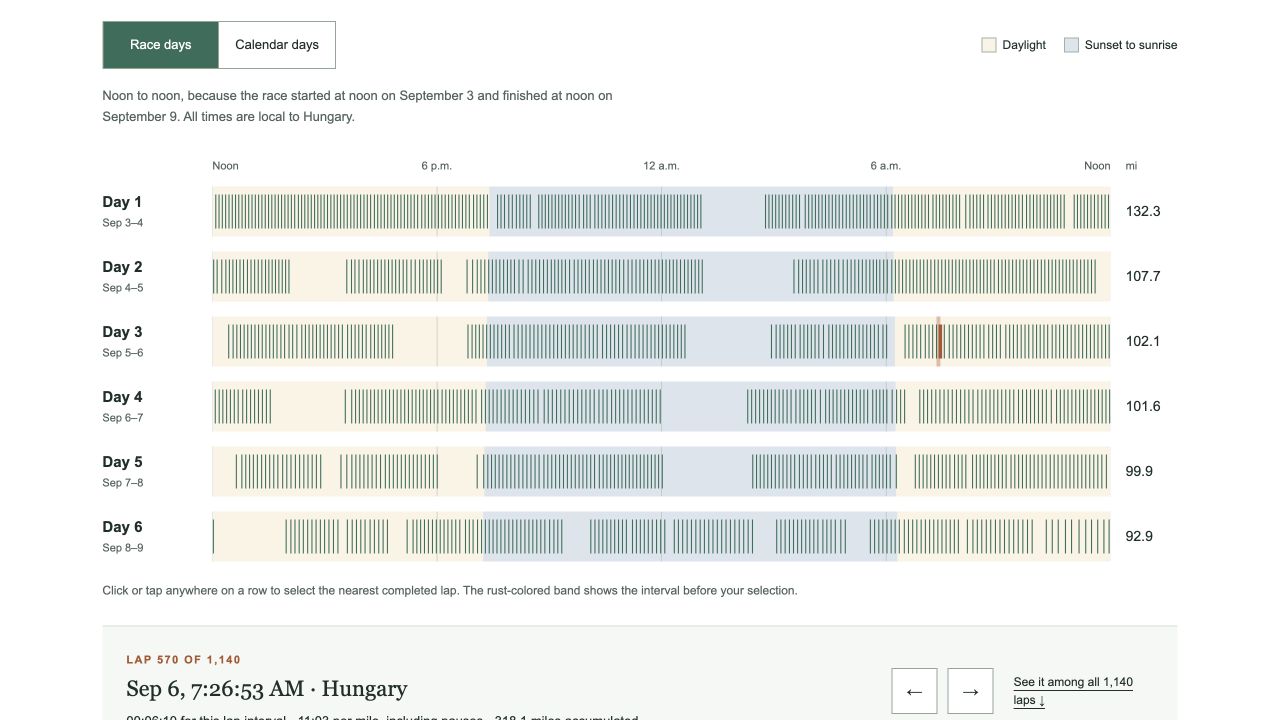
What does six days of running look like?
Eckert’s performance was the kind of headline that made me want to look closer. The official timing data offered a way to explore how the race unfolded, lap by lap, across six days and nights.
I researched, designed and built an interactive feature around that record: the rhythm of the laps, the changing pace, historical context and an explorer for the individual laps.
Make the data explorable without overstating it.
The same lap can be located in the day-and-night chart and in the full collection of laps. Readers can move through the race and see the elapsed time and accumulated distance at each point.
The explanations matter as much as the controls. A lap interval can include time away from the course. The timing record shows when a runner crossed the mat, but it cannot tell us why a particular interval was longer. The feature keeps that distinction visible.